Assignment 3 (6b)
*Files used for this assignment are located in here (GitHub).
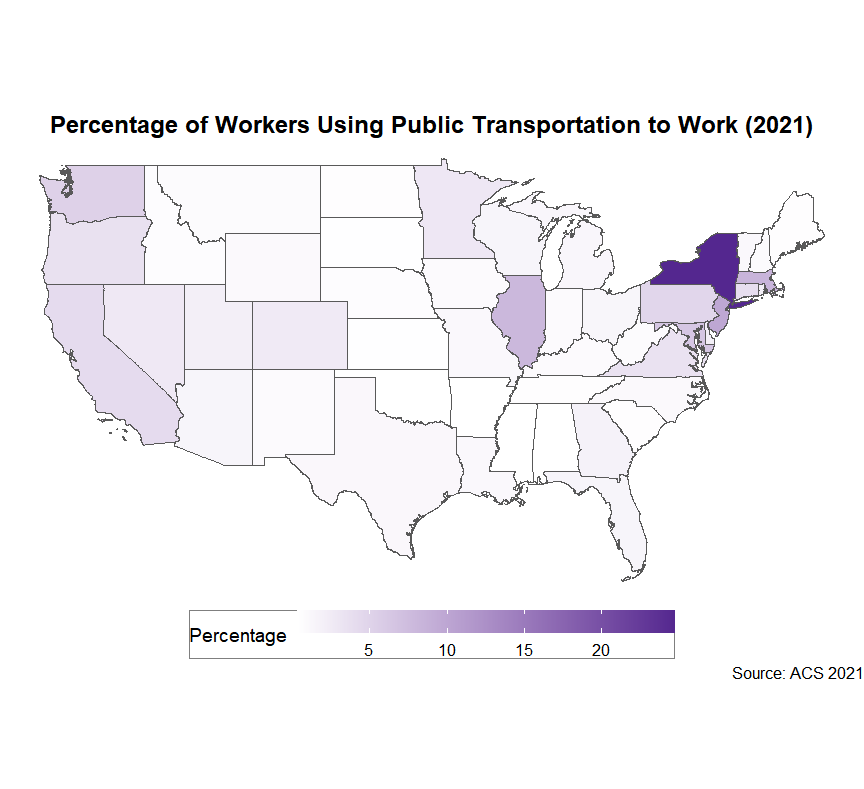
1. A Map Using Variables of Choice From TidyCencus
I made a map using data B08101_001 and B08101_025 of ACS 5years using TidyCensus in assign3.R.
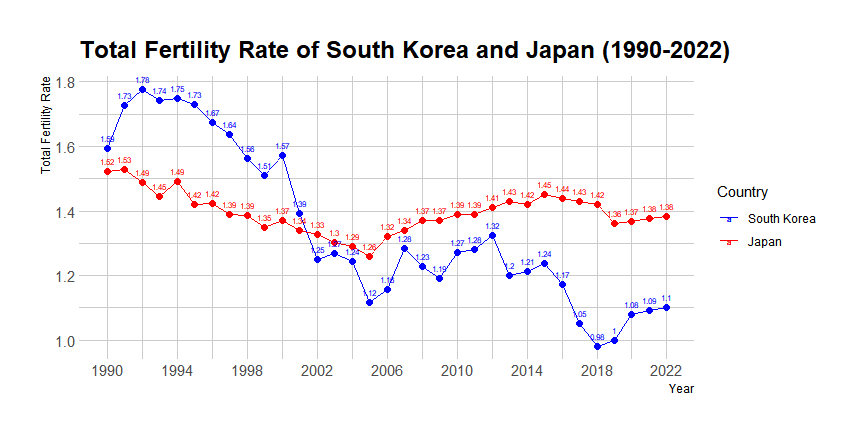
2. A Graph Using the World Data and IDBR Package
I made a graph using idbr package with TFR (Total Fertility Rate) data in assign3.R.
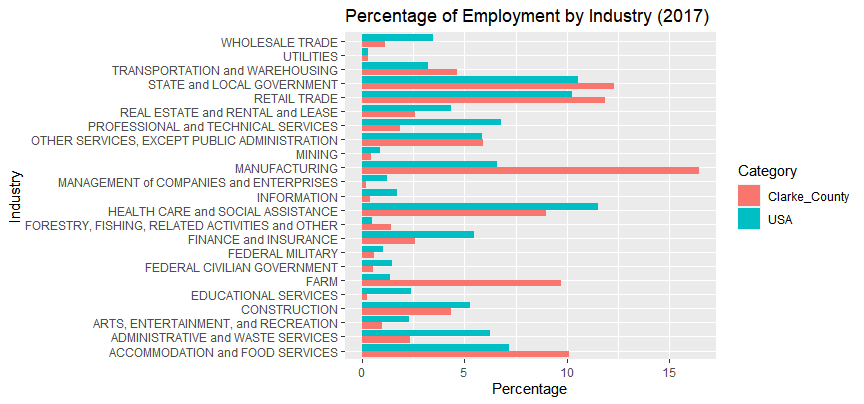
A Grouped Bar Graph Using .xlsx File.
I made a grouped bar graph using data sourced from my CRP566: Policy Analysis and Planning class. I cleaned up the data in assign.xlsx before bringing it into R. Using the assign3.R, I plotted the resulting data on a grouped bar graph using the ggplot.